Ryan Robinson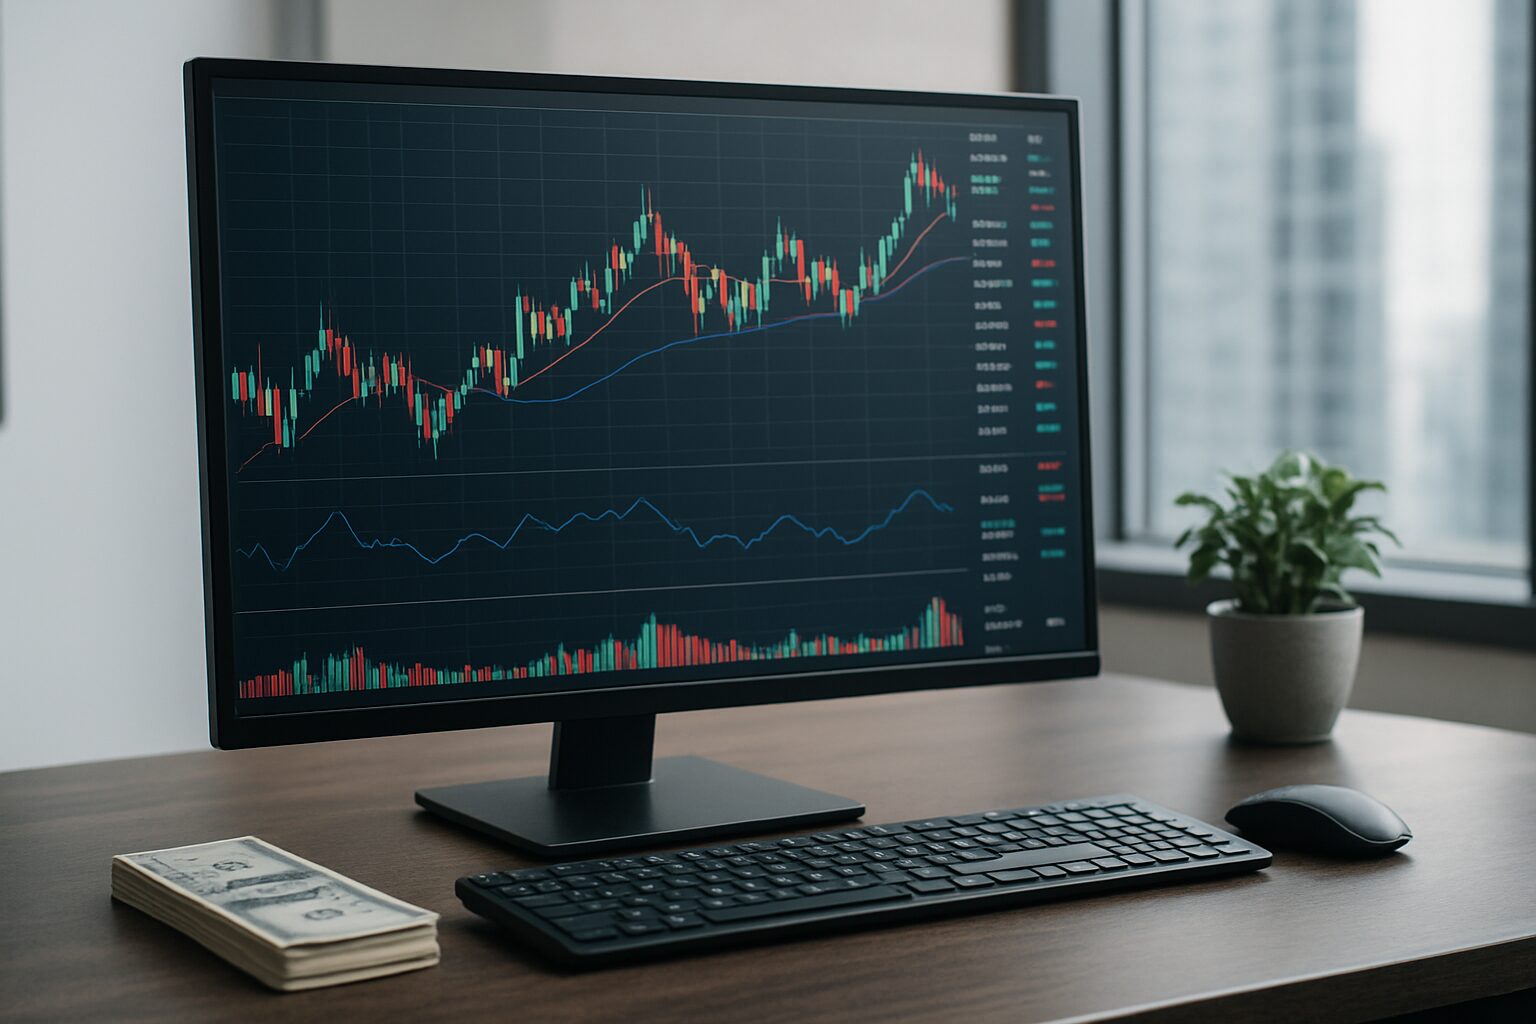
Technical analysis plays an important role in the way many traders study financial markets. Price charts, indicators, trend observations, and historical data can help traders develop a structured view of market behavior. For users seeking an organized digital workspace, the MT4 Platform provides charting and analytical tools that can support different approaches to market research and trading preparation.
Contents
- Understanding Charting Tools
- Technical Indicators
- Drawing and Analytical Functions
- Multiple Timeframe Analysis
- Creating an Organized Workspace
- Importance of Careful Analysis
- Conclusion
Understanding Charting Tools
Charts provide a visual representation of price movements over a selected period. Instead of examining numerical prices individually, traders can use charts to identify patterns, trends, and changes in market activity.
Different chart timeframes can be useful for different purposes. Shorter timeframes may help traders examine immediate price fluctuations, while longer timeframes can provide a broader perspective on market direction. Comparing multiple timeframes may help users understand how short-term movements relate to wider trends.
Charts can also be adjusted according to personal preferences. Traders may choose suitable viewing periods and organize their workspace so that frequently monitored instruments remain easily accessible.
Technical Indicators
Technical indicators are commonly used to examine specific characteristics of price behavior. Depending on the trading approach, users may study momentum, trend strength, volatility, or potential changes in market direction.
Moving averages, oscillators, and other analytical calculations can provide additional perspectives on price activity. Traders may combine several indicators, although using too many at once can make analysis unnecessarily complicated.
Indicators should be considered supporting tools rather than guaranteed prediction systems. Market prices can be influenced by many factors, and historical patterns do not ensure that similar movements will occur in the future.
Drawing and Analytical Functions
Charting environments can become more useful when traders have access to drawing tools. Trend lines, horizontal levels, channels, and other visual markings can help users organize their observations directly on price charts.
Support and resistance areas are examples of information that traders may mark for easier reference. These levels can help users monitor how prices behave when approaching previously significant areas.
Drawing tools also allow traders to develop a clearer visual record of their analysis. Keeping observations organized can make it easier to review a trading idea before making a decision.
Multiple Timeframe Analysis
Market movements can appear different depending on the timeframe being examined. A short-term price increase may occur within a larger downward trend, while a temporary decline may appear during a broader upward movement.
Multiple timeframe analysis can help traders avoid focusing on only one portion of market activity. Reviewing different periods may provide additional context and encourage more balanced analysis.
This approach can be particularly useful when traders have strategies that depend on both broader trends and shorter-term price movements.
Creating an Organized Workspace
A practical trading workspace should provide access to relevant information without creating unnecessary distractions. Traders can arrange charts, indicators, and market lists according to their individual methods.
An organized layout can make regular analysis more efficient. When frequently used tools are easy to locate, traders may spend more time studying market conditions and less time adjusting their workspace.
Customization can also help users maintain consistency when reviewing markets each day.
Importance of Careful Analysis
Technical tools can support decision-making, but they should be used with discipline. Traders should avoid treating individual indicators or chart patterns as certain signals.
Combining technical observations with sound risk management can create a more balanced trading process. Position size, leverage, potential losses, and exit planning should be considered before entering a trade.
Maintaining records of previous analysis can also help traders evaluate whether their methods are producing consistent results.
Conclusion
The MT4 Platform offers charting and technical analysis tools that can help traders examine price movements, study trends, use indicators, and organize market observations. Its analytical functions can support both simple and more detailed approaches to technical research.
However, no charting tool can remove the uncertainty of financial markets. Effective trading requires knowledge, preparation, patience, and responsible risk management. By learning how to use analytical features properly, traders can build a more structured process for understanding market behavior and preparing their trading decisions.